The 2022 World Cup was the most exciting, and most watched, ever, with 5 billion people engaging with the tournament. And with so many Vizrt team members in Argentina, we were especially happy with the results!
We are also proud that our HTML5 graphics played a big role in adding to the World Cup experience for fans all over the world. Several of our customers used the Viz Flowics platform in workflows to augment broadcasts with real-time, data-driven on-screen graphics; to display schedules and results; and drive fan interaction through social media and other channels.
Here’s a quick look at how…
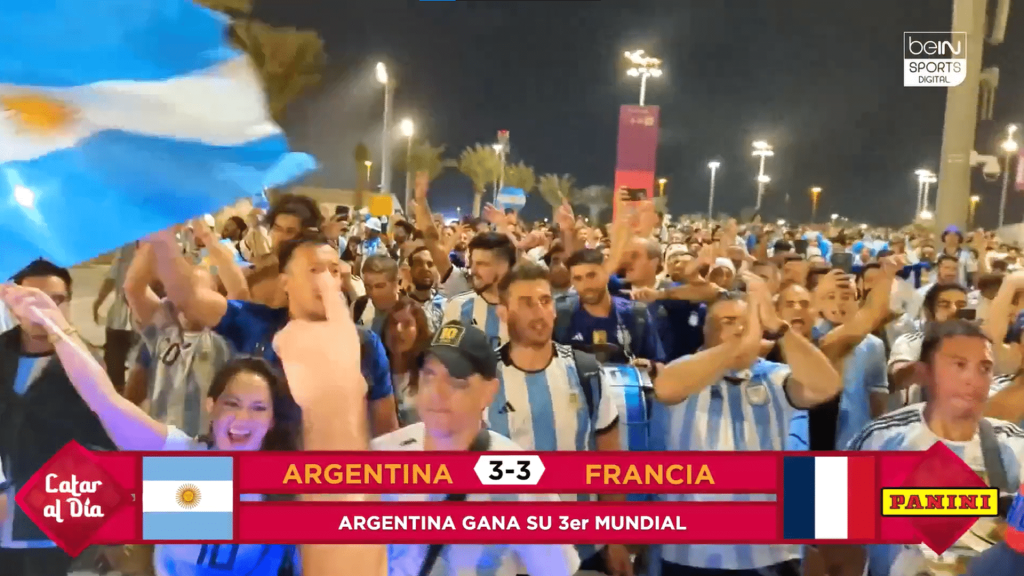
beIN Sports (USA)
beIN Sports used Viz Flowics as the graphics platform to produce the daily show “Catar al Día.” The network also used the social media add-on to create integrated Twitter polls and audience comments on air along with official content from the teams, federations and players.
Solutions involved: Viz Flowics + Social Media add-on
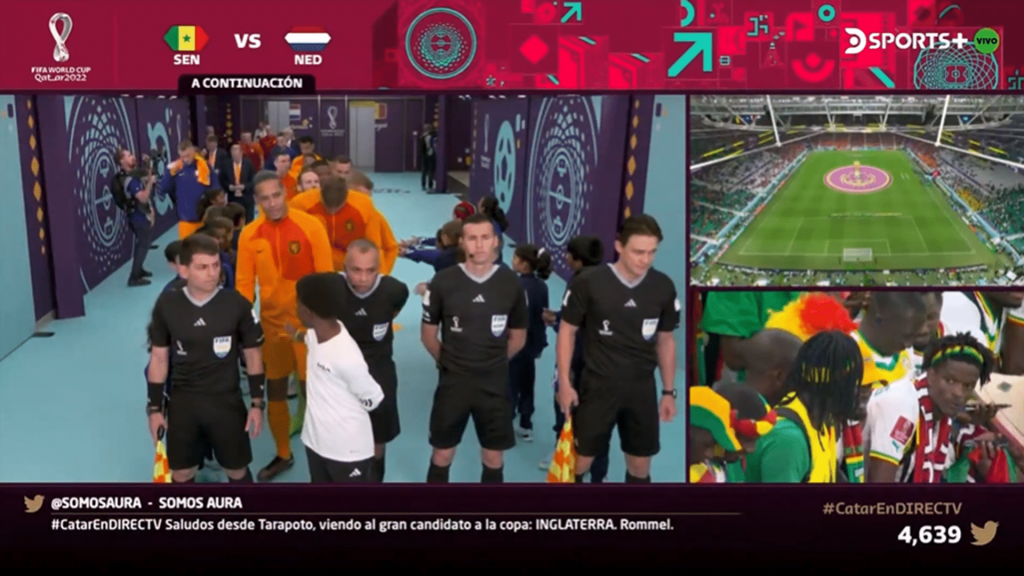
DirecTV Sports (Latin America)
DirecTV Sports set up a multi-camera viewer experience for the broadcast of the games and used Flowics to add in audience participation on social media showing comments, live reactions, and mentioning Tweets that came in using the hashtag #CatarEnDirecTV.
Solutions: Middleware + Social Media add-on
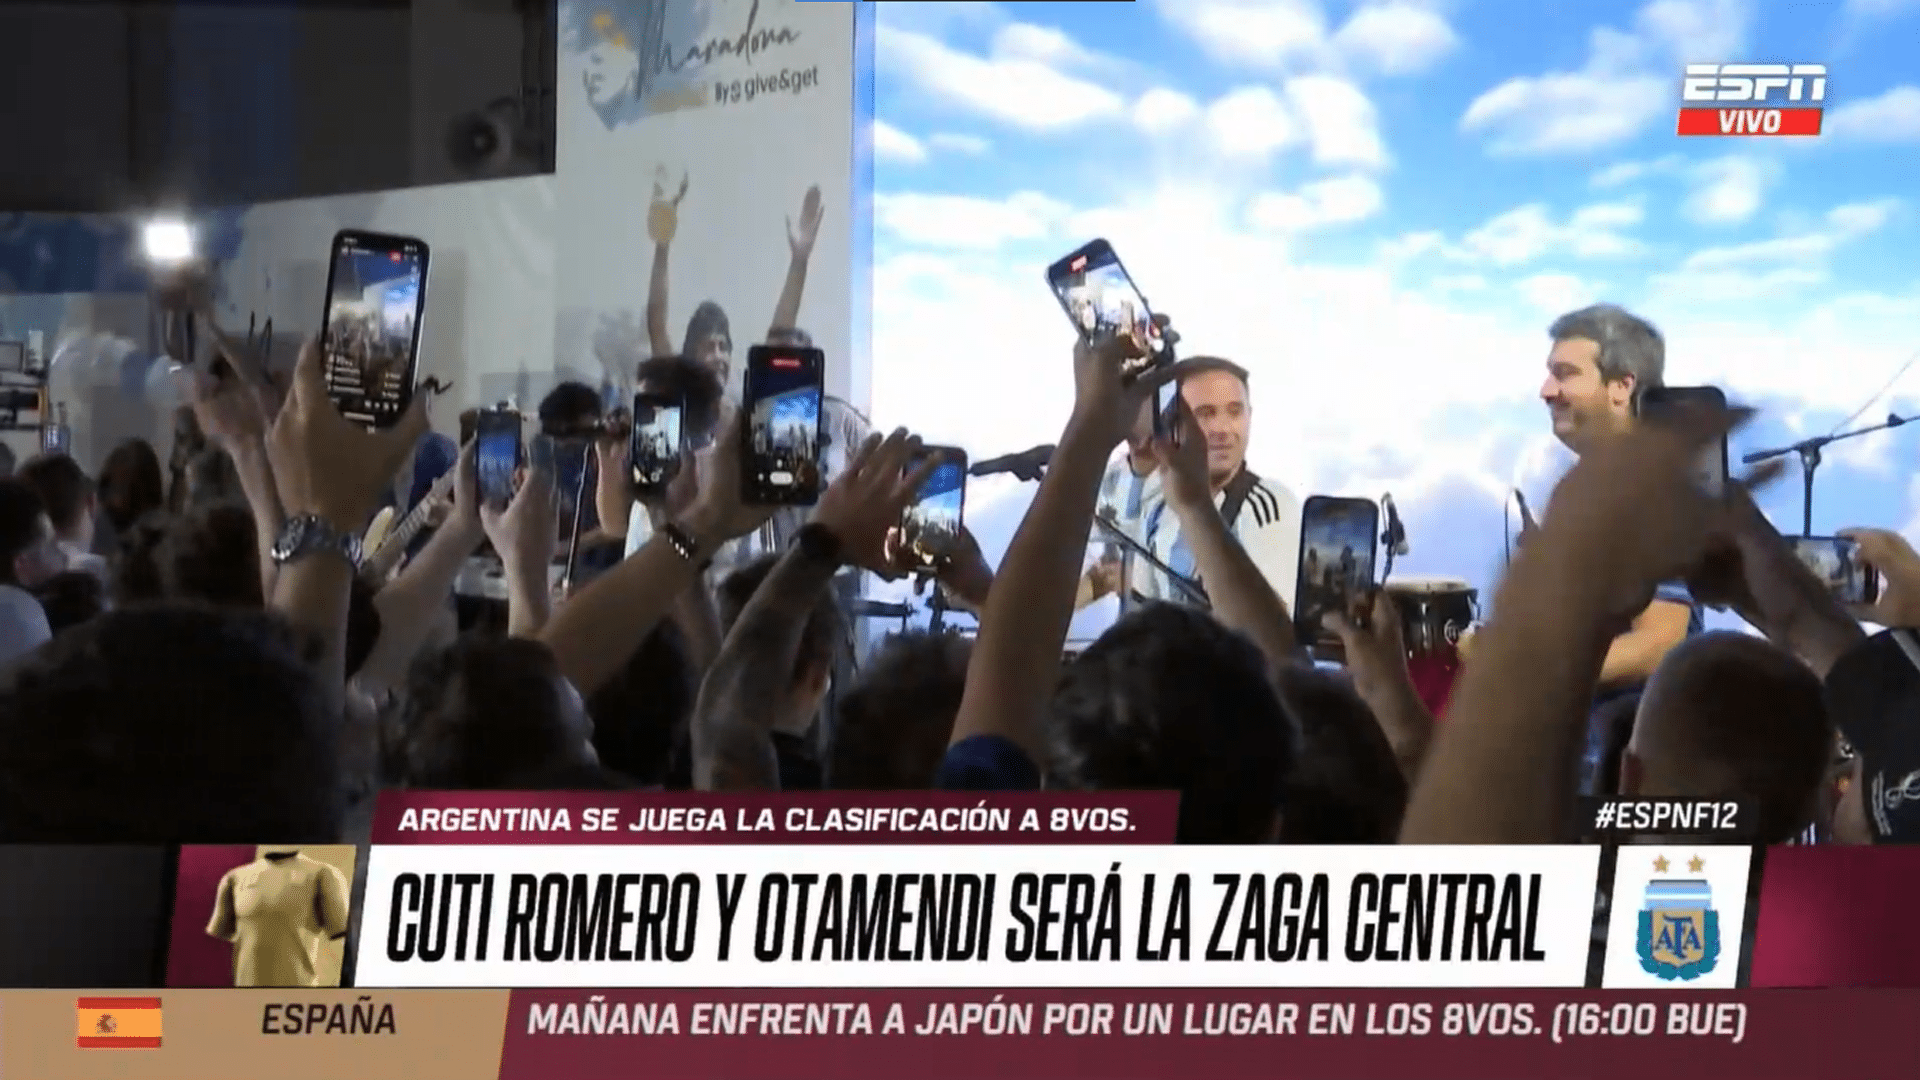
ESPN Argentina
ESPN used Viz Flowics for different production workflows. The sports TV network created a special ticker showing results, positions, and other relevant information surrounding the World Cup. It also conducted live polls (available through QR codes on screen) and offered sweepstakes during its “SportsCenter” show, allowing the audience to participate using a hashtag.
Solutions for Vizrt HTML5 graphics workflow: Viz Flowics + Social Media add-on + Second Screen add-on

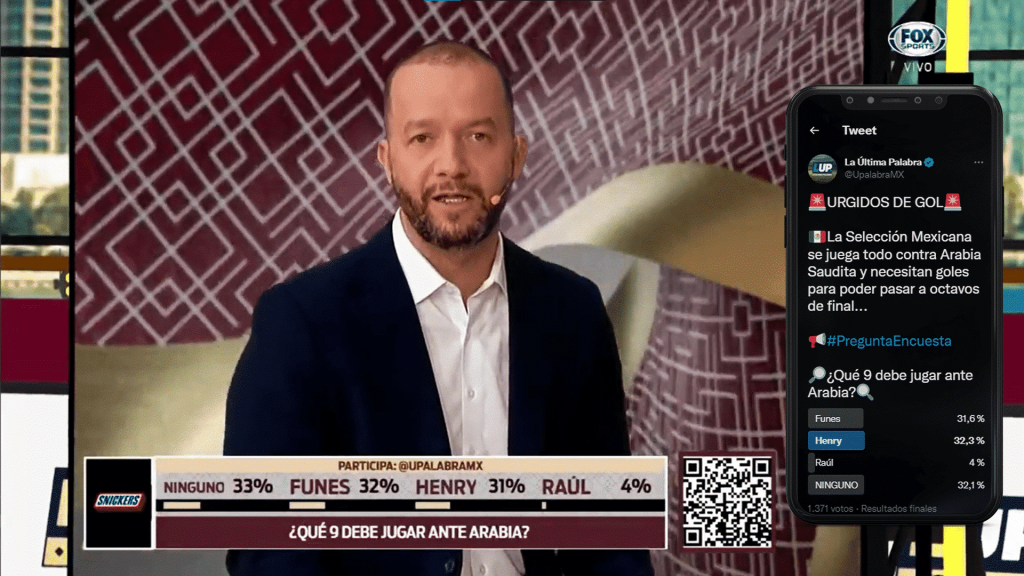
Fox Sports (Mexico)
The show “La Última Palabra” used Viz Flowics to display graphics with QR codes that directed the audience to Twitter polls. The broadcaster used this every day to open the show and kept it active until the end of each show.
Solutions: Viz Flowics + Social Media add-on
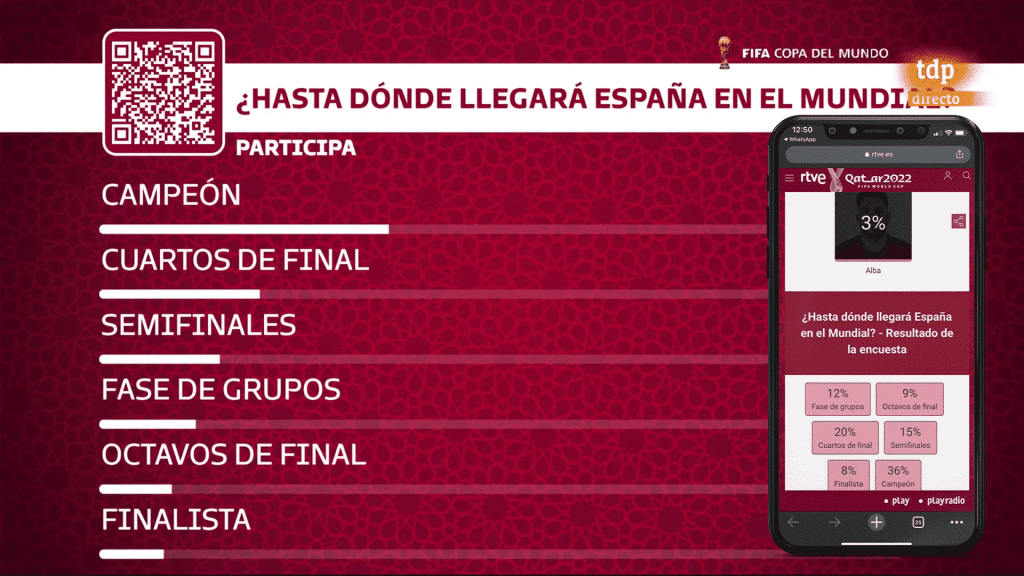
RTVE (Spain)
RTVE used Viz Flowics on the “Estudio Estadio Mundial” show to boost participation via social media. The results were then displayed on-air during the shows. The channel used the Second Screen module to create topical online polls for its readers.
RTVE also used a QR code to invite the audience to vote on the website. All graphics associated with these participation mechanics were entirely built in Viz Flowics.
Solutions: Viz Flowics + Social Media add-on + Second Screen add-on
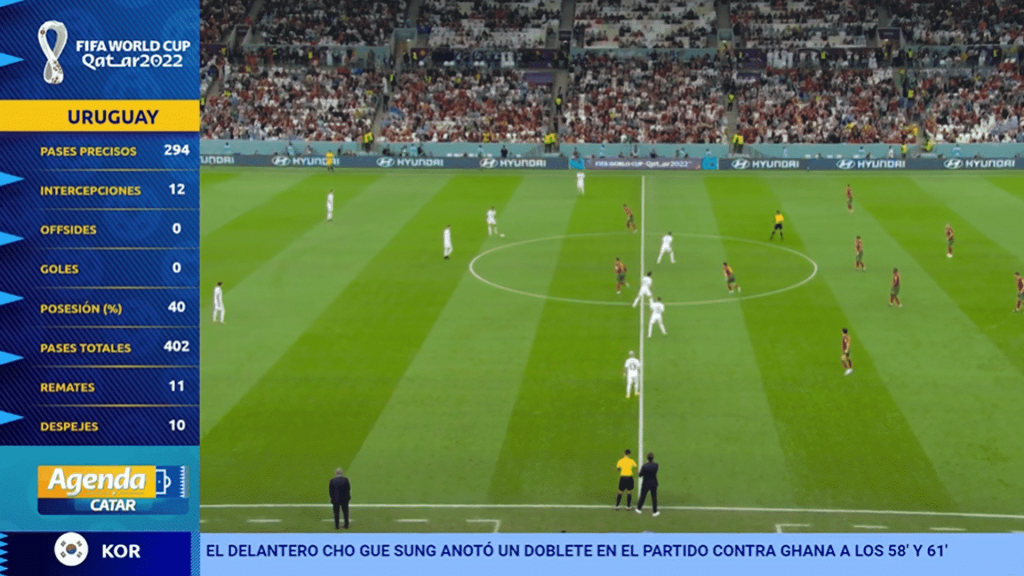
Tigo Sports Paraguay
Tigo Sports used Flowics graphics to create an L-Bar graphics used before and after each game. During the pre-game show, viewers could find relevant information about the teams, leaderboards, game and player stats, and short information pills with titles and other relevant details.
Solutions: Viz Flowics + Google Sheets data provider
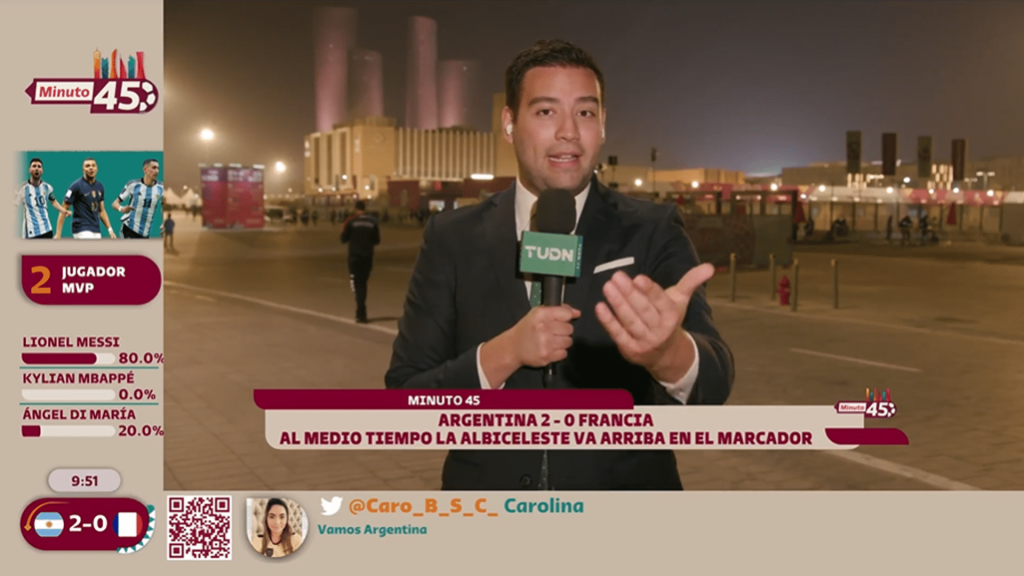
TUDN (USA)
Since TUDN USA did not have the broadcast rights for the games, it produced a show, “Minuto 45,” that ran during the midpoint of matches. TUDN used Viz Flowics to power interactive mechanics on an L-Bar. It included the possibility of scanning a QR code that redirected viewers to poll to choose the ‘man of the match’. It also pulled in social media comments from different sources in real-time from fans across the globe.
Solutions: Flowics Middleware (integrated with Vizrt graphics) + Social Media add-on

Ready to power up your live shows?
See how Viz Flowics can help you simplify graphics creation and better engage with sports fans via interactive tools in this free comprehensive guide to understanding and using HTML5 cloud graphics.