2024 is not just a big year for sports (UEFA Euro 2024 & Summer Games), but it’s also the biggest election year in history with more than 50 countries, or in other words half the global population, heading to the polls. The big one that most, if not all, broadcasters will be focusing on is of course the US Presidential election in November.
Journalists and technical teams will tell you that elections are challenging to produce but there’s nothing quite like the rush you get when all the well-laid plans are executed without a hitch.
“Election coverage for TVNZ is one of those big signature pieces that we do every three years, so it’s important that we get that right for our viewers,” says Lindsay Chalmers, General Manager for Enterprise Operations at TVNZ.
I completely agree with Lindsay, and with this being THE SUPER ELECTION year, I sat down with my fellow election-veteran colleagues, Ionut ‘Johnny’ Pogacean, Senior Program Manager and Senior Pre-Sales Consultant Russell Leak to look at how elections have evolved, and how broadcasters wow audiences with dynamic storytelling and cutting-edge technology, especially in graphics and virtual reality, and to look at how elections could be covered in the future.
Lessons from the past
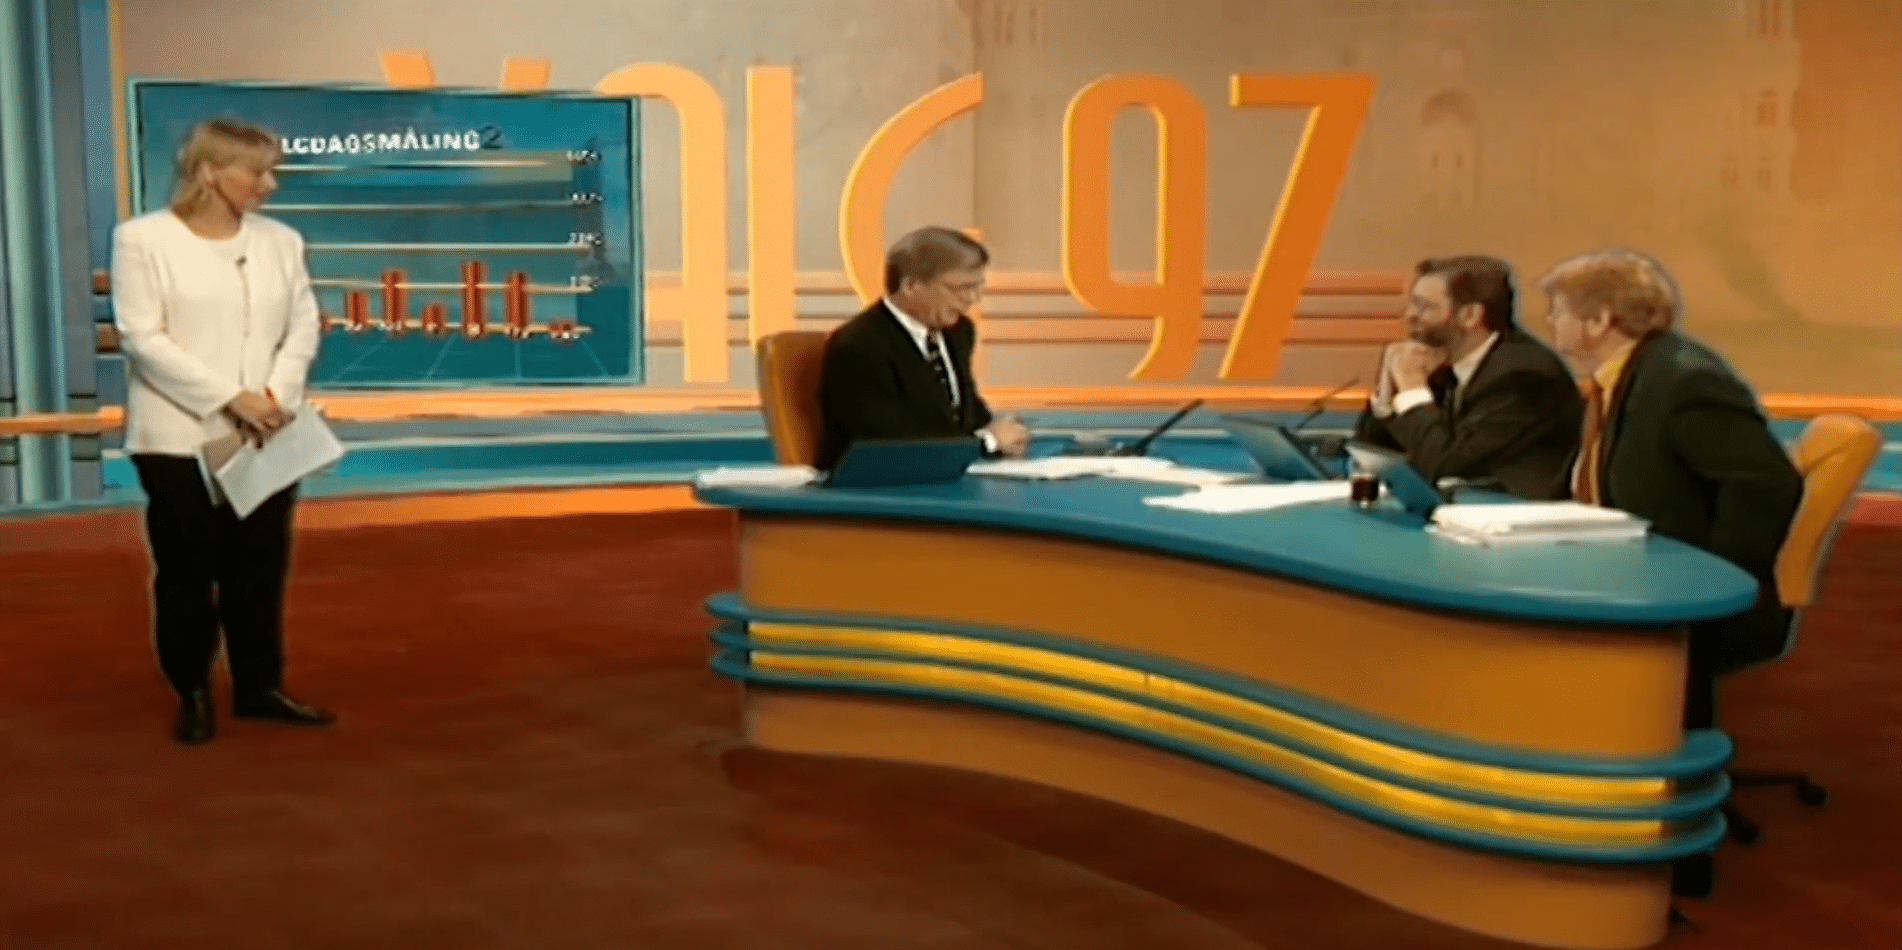
Vizrt was first involved in elections way back in the 90s. Above we see a relatively simple bar chart displaying elections graphics for TV2 Norway’s virtual set during its 1997 Norwegian general elections coverage. This was the first templated graphics system ever on television, and the technology created to help power it was the beginning of Vizrt.
We’ve come a long way since then. Bar charts and swingometers have evolved into virtual real-time data-driven graphics and augmented reality, for a richer and more immersive viewing experience.
Stepping it up a notch with every election
Data and graphics drive election coverage. Every producer is looking to leverage the latest technology in graphics, elevate storytelling, and have an edge over competitors. To crunch and crank out the information as it comes in, giving viewers a dynamic, easy-to-understand minute-by-minute view of the election as it unfolds.
More eyeballs = more credibility = more advertising revenue.
Design teams put a lot of time, consideration, and effort into creating the most visually attractive, flexible and future-proof graphics. As the team at TVNZ, which recorded its most-watched elections in November 2023 pointed out, elections are often the catalyst for updating and futureproofing graphics and AR branding.
This is our third election cycle of using Vizrt to drive data graphics. We can crunch and visualize a lot of data very quickly. We use elections to set the standard of where we want our graphics, design, and augmented reality capability to be for the next one, two, or three years.
Mark Fleming
TVNZ Design Lead
With Viz Pilot Edge supporting scripting and direct data integration into templated graphics, it’s easy to immediately visualize data in rapidly evolving situations like election reporting.
“In 2024, we’re adding more straightforward ways to achieve complex tasks with additional native functionality to the Template Builder scripting module,” says Johnny.
“Additionally, further advanced functionality that will allow total control can be unlocked by leveraging the custom HTML framework available in Viz Pilot Edge, helping template designers use their native HTML skills to create more advanced templates.
“Of course, we’re not going to stop there. We already have plans that include extending the capabilities of Viz Datacenter for newsroom workflows and elections. This will have a massive benefit for anyone using any data in their graphics. And, let’s be honest, isn’t that everyone?”
Simplifying workflows with Metadata
As a former journalist, I cannot say how much I appreciate the ability to automatically fetch and autofill fields in a template.
Scripting functionality has been extended since Viz Pilot Edge 2.4 to fetch metadata from image assets. This means that if image metadata fields exist such as name, title, role, party or other election or political statistics, it can be autopopulated into a template during election coverage.
Mapping voter behavior
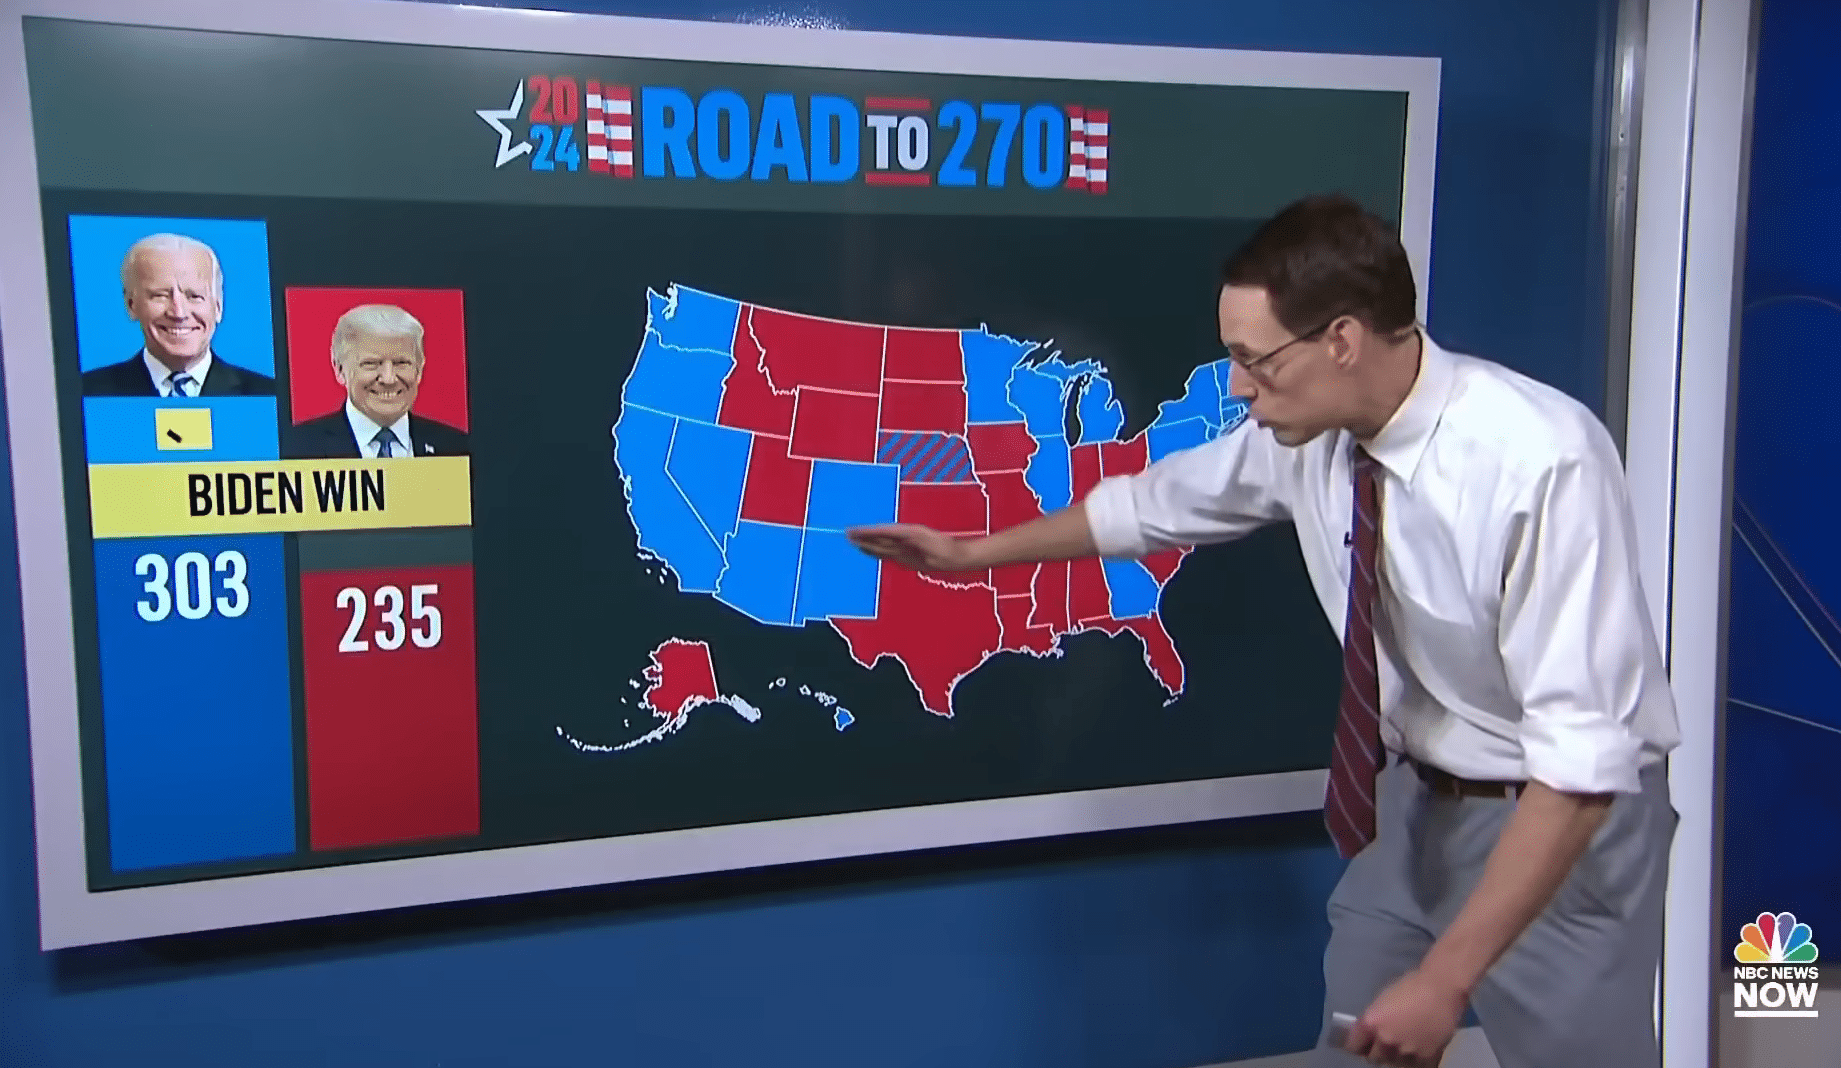
Maps have been an integral part of any election coverage since day one. Today’s maps often feature sophisticated geospatial data, such as heat maps, to clearly show how different constituencies or states vote.
While touchscreen maps can immediately give voters a clear idea of how the candidates or parties are stacking up against one another.
Augmenting the viewer experience
Add to this mix augmented reality which can create a more immersive and engaging presentation of election data, as recently shown by TVNZ, using a host of Vizrt solutions.
TVNZ made full use of AR graphics and the videowall, moving presenters between sets to give a comprehensive view of the shape of the elections.
Positioning the presenter in front of a video wall provides them with an effective space to drill down deeper into the data. Talent can also be immersed within the graphics as seen above where the presented is placed in a virtual parliament floor showing the actual seats won gives more relevance to the viewer, especially when trying to explain some of the more complex political elements, such as the US Electoral College, to a global audience.
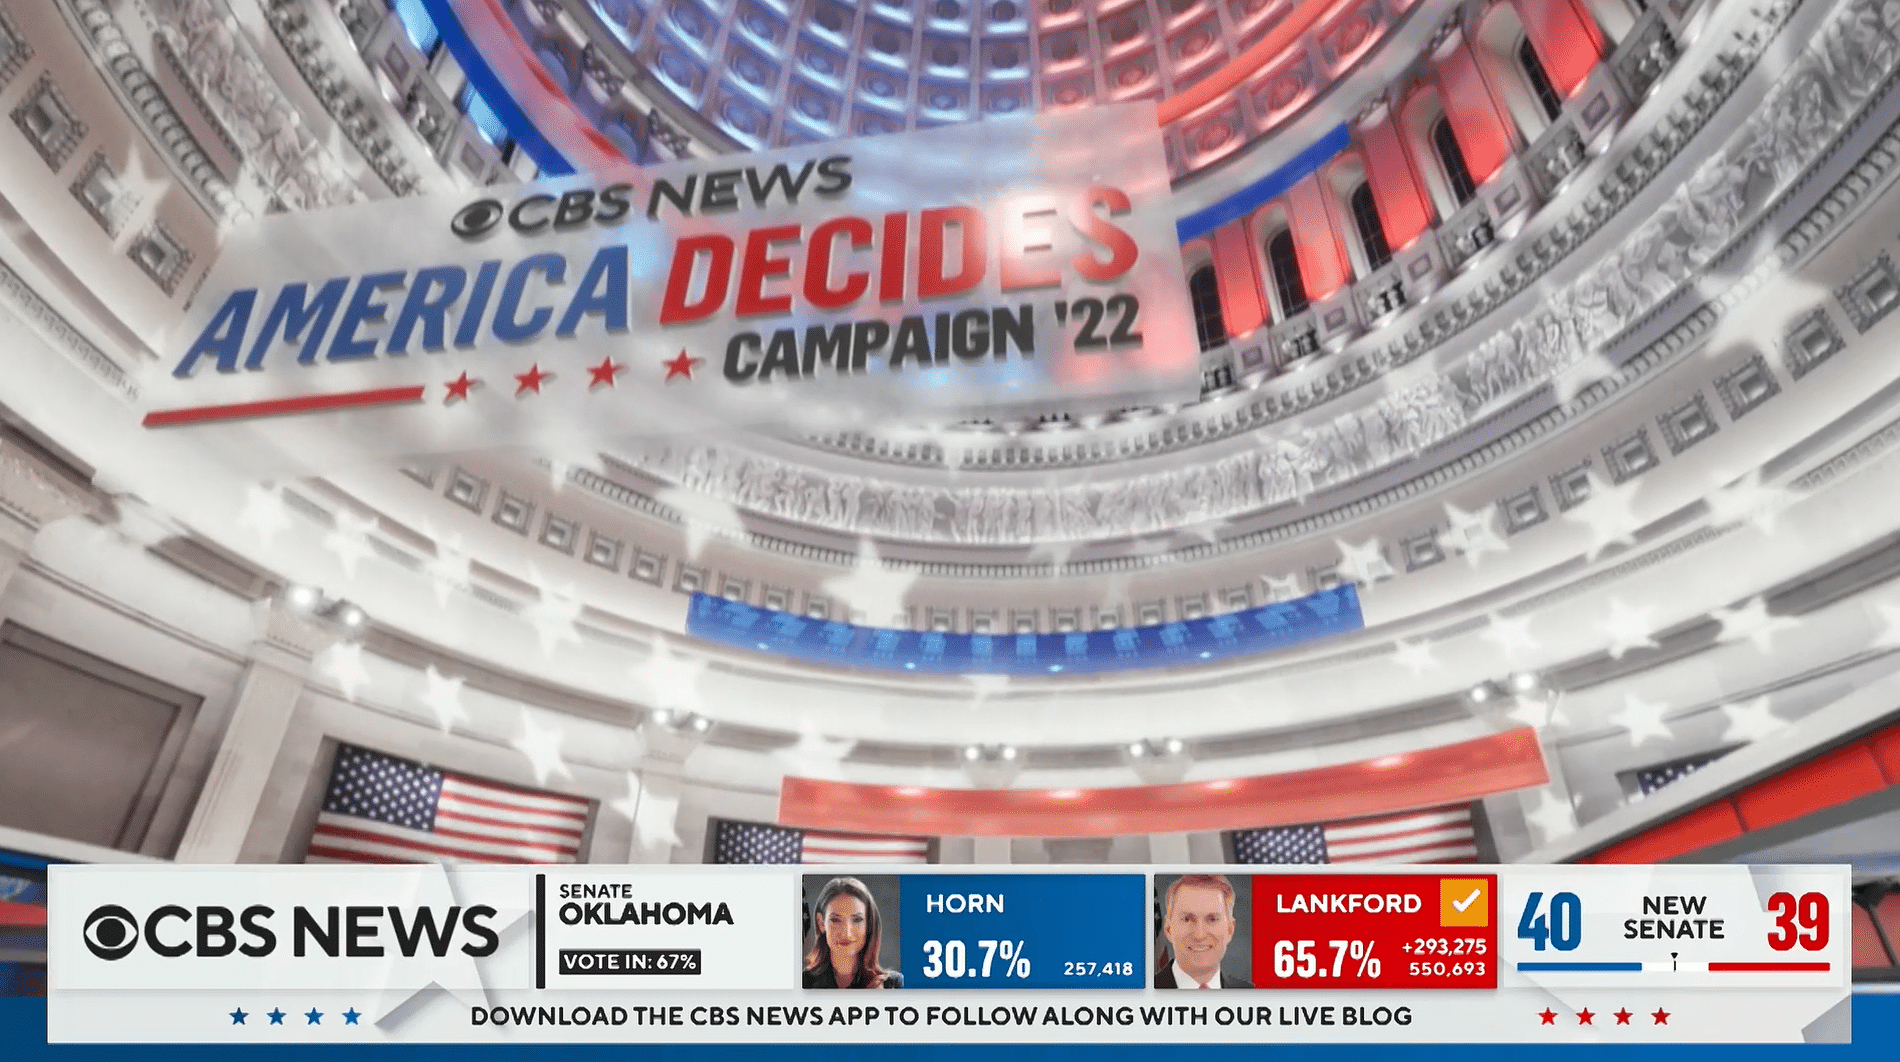
CBS went further with its election vision with a groundbreaking modular AR set for the 2022 elections which meant they could add any data to the building in seconds. Viz Engine 5 made it possible for the crew to visualize the data seamlessly in the same space as the presenters. And, to replicate the Congress dome on the lighting grid – bringing alive an otherwise dead space in the studio.
Keep the information ticking with crawlers
CNN Headline News was among the first broadcasters to deploy a continuous ticker back in the 1980s. This nifty tool is now ubiquitous with news coverage because it is known as ‘the quickest way to deliver an update or breaking news’.
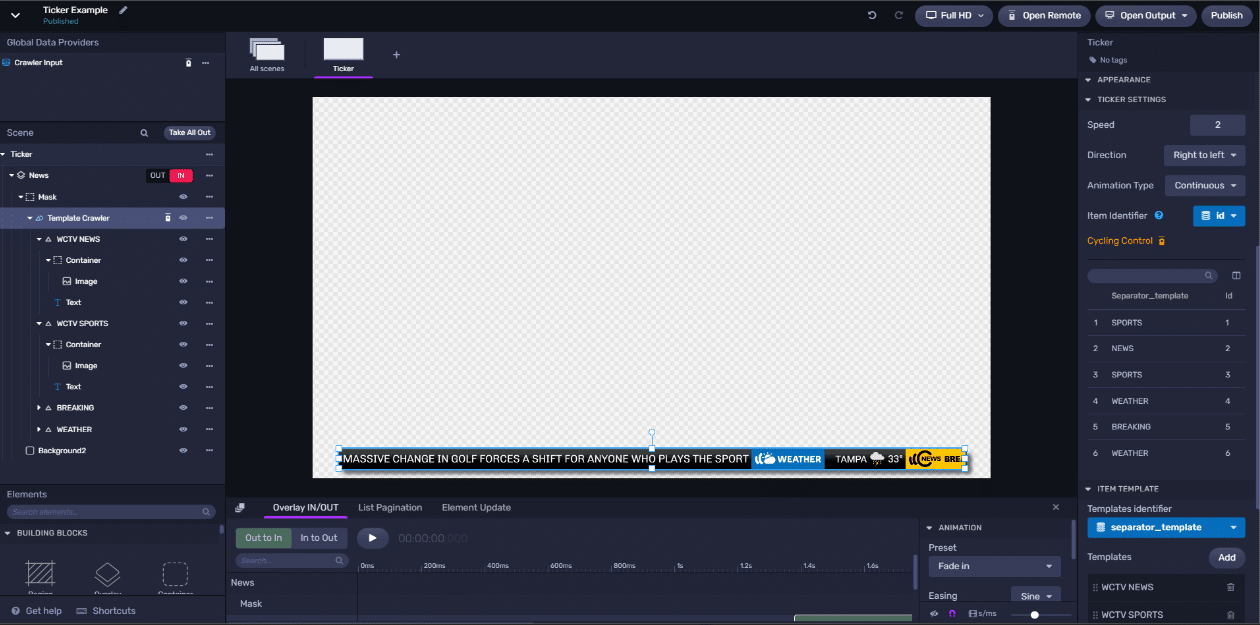
Viz Flowics has just this year released a brand-new ticker that supports multiple templates to render stories in different formats based on the ‘item type’. Some of the world’s top broadcasters and ticker pioneers have already adopted this easy and effortless to use ticker. What’s special is that the Viz Flowics Ticker can be configured to remember the last story on air before the ticker is taken out (during a break in programming) and will cleverly resume from that same story when taken in after the break.
The big advantage of tickers is of course its ability to display as many different headlines as possible, the latest vote count, and other updates on the same page, maximizing screen real estate.
Digital and social media – Gen Z’s news platform
And let’s not forget social media integration and digital real estate. There’s now a greater emphasis not just on story versioning to tailor content, but also on customizing graphics for different audiences, using templated graphics to present data quickly and efficiently to different groups of viewers.
In 2023, two Norwegian newspapers, Sunnmørsposten and Fædrelandsvennen hit an innovative milestone, to ‘televise’ live the September local elections on their online portal.
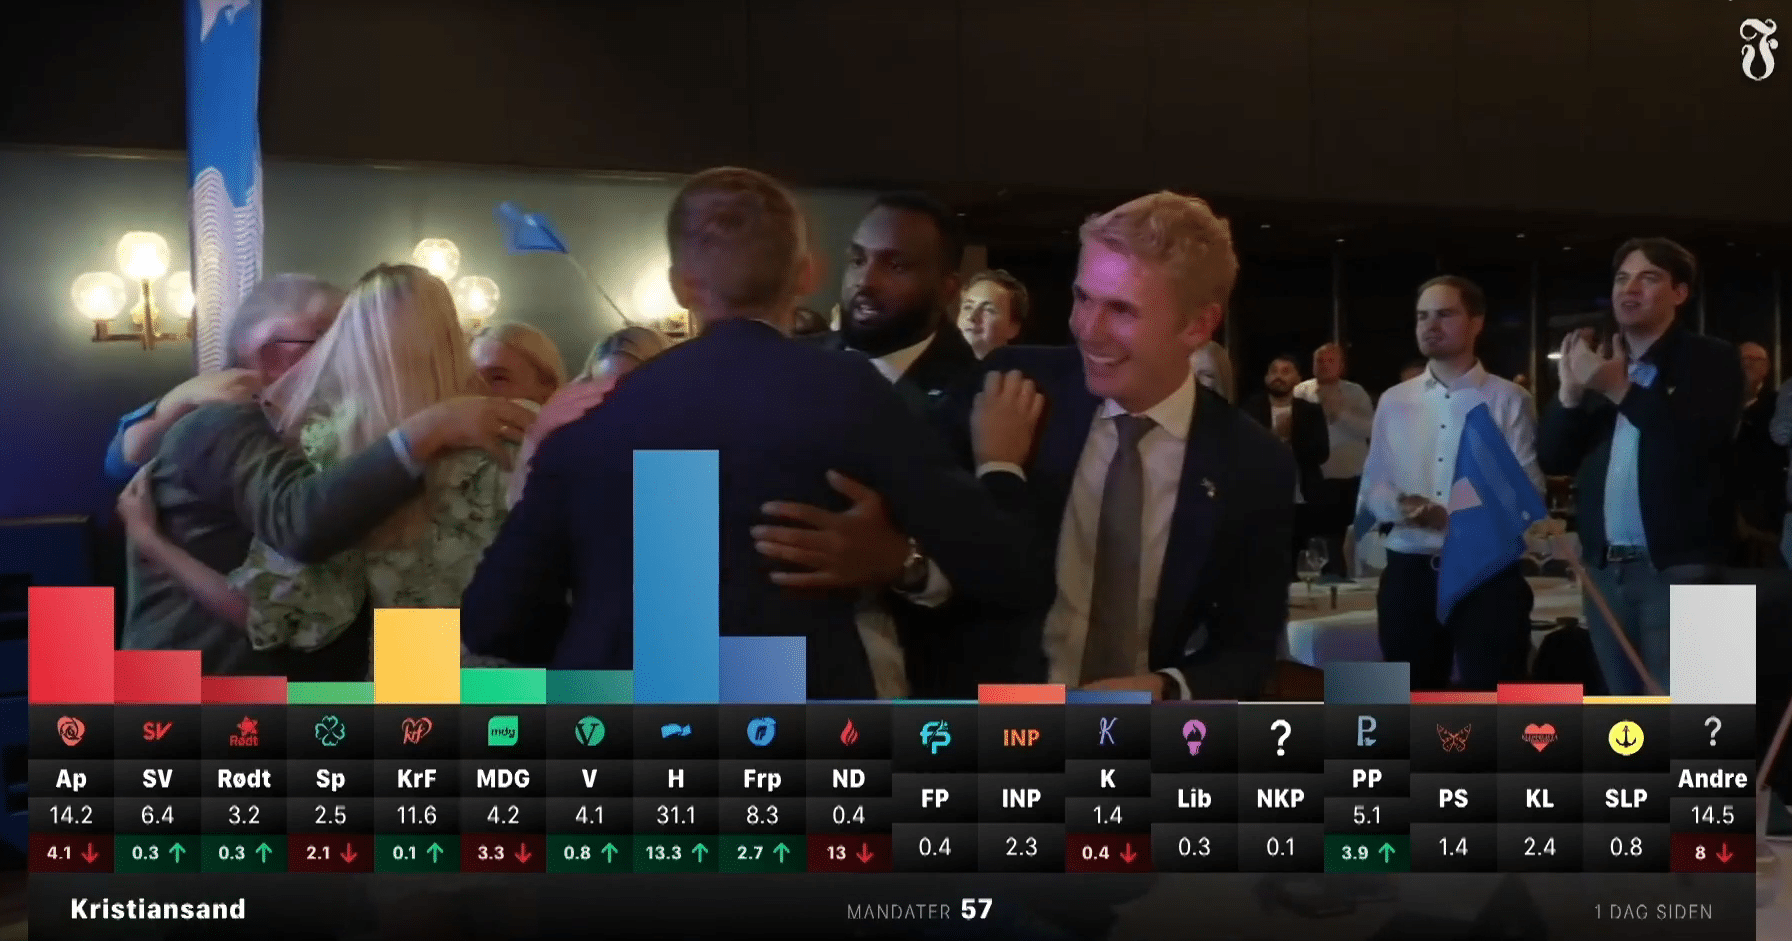
Viz Flowics is a very intuitive, amazing, and cost-effective tool, which was easy to learn and use in a very short time. It helped us create all the graphics we needed from bugs to location straps, name supers, tickers, and data-driven graphics showing the results as they unfolded during vote counting.
Frode Nordbø
Head of Graphics at Norwegian newspaper Fædrelandsvennen
Fædrelandsvennen used Viz Flowics for their online live data election graphics, branding, bugs, and ticker, seamlessly delivering all the election highlights to news consumers on any digital device.
The other benefit of using an HTML5 graphics solution is the flexibility to spin up pop-up OTT channels in the cloud to give an even more curated view of time-limited events such as elections. Cost-effective, no-latency, swift, controllable by a single remote operator, and mirrored on the ground, linear production. It is the future of customized content delivery.
Test. Test. Test.
Sky’s Chris Flye has been knee-deep in elections for decades. His top tip is to “never give a touchscreen or iPad to a presenter to use live unless they know it backwards. Work directly with them so they understand the graphics and the interface. Nothing looks worse than a presenter with a ‘rabbit in headlights look’ when they can’t use the kit.”
“Test, test, test! You can never test enough, and if the graphics are data-fed, double the build time.”
Russell: “My first experience with election coverage was in 2005 – providing a virtual studio for the BBC. The challenge was representing 650 constituencies graphically, each requiring 3D geometry which pushed the limits of the most advanced GPUs and render engines at the time. During a rehearsal, we discovered a flaw in our plan. Animating numerous 3D objects in a virtual reality set resulted in a GPU overload, leading to unintentionally slow-motion graphics. Lesson learned. Test graphics ahead of time and with the actual hardware you will use for output, as designs that work on a workstation can fail when integrated with additional components like data and control systems.”
“I will reiterate that point of testing on actual equipment, with actual AND backup workflows,” adds Johnny. “There was this one time when there were some issues with the main control room, so we ended up jerryrigging (we’ve all been there, right?) the second gallery for output. Everything was ready, and looked great, until someone asked, ‘How are we getting the output to MCR?’ Let me just say, there was panic on the floor, but luckily for us, we managed to figure it out just in time for the big show.”
Looking ahead
Ultimately, it’s important to ensure that technology is not being deployed for technology’s sake, but rather, to complement and elevate the storytelling.
There will be many more advancements – AI, and immersive technology (virtual and augmented reality) – that are poised to further shake up how elections will be covered in the future. But in our view, there are a few things that will not change. No matter the technological advancements, the coverage being successful will be dependent on your people and your storytelling ethos.
We recommend bringing in all the stakeholders, and the people who will be fronting your news coverage, as early on as possible into the planning structure, and consider when planning, how the technology trend of the day can serve your storytelling and captivate the ever-fickle viewer.
In search of new ways to engage audiences and present your best election coverage ever with synchronized data across all your graphics from tickers to full frames and stunning AR? We have solutions for linear, OTT, digital, and mobile media.